
Everyone’s telling you to dump your active funds and “slow” growing stocks and just buy the index, some hot AI companies and last year’s best performing managers. Thirty years in this seat has taught me that oral volume seldom aligns with wealth creation. No better time to dig deep into the data and make well informed decisions. Or, read this article, we’ve done so for you.
That experience lends itself to avoiding spats on subjects debated by those bellowing loudest on public stages whilst being adjudicated by keyboard warriors.
But that should not curtail me from airing our views, particularly as these are pragmatic and always in the interest of our clients.
Points of discussion
In this article I will discuss whether it is rational being a stock market investor, if there are times when the odds of making money are higher than average and vice versa, and if now, or ever, is a good time to sell out of well managed active portfolios and to direct this capital into mainstream passive indices. This article is not aiming to debate the merits or demerits of active versus passive management, that is well whipped and boring!
Does owning the market as an investor make sense over the long-term?
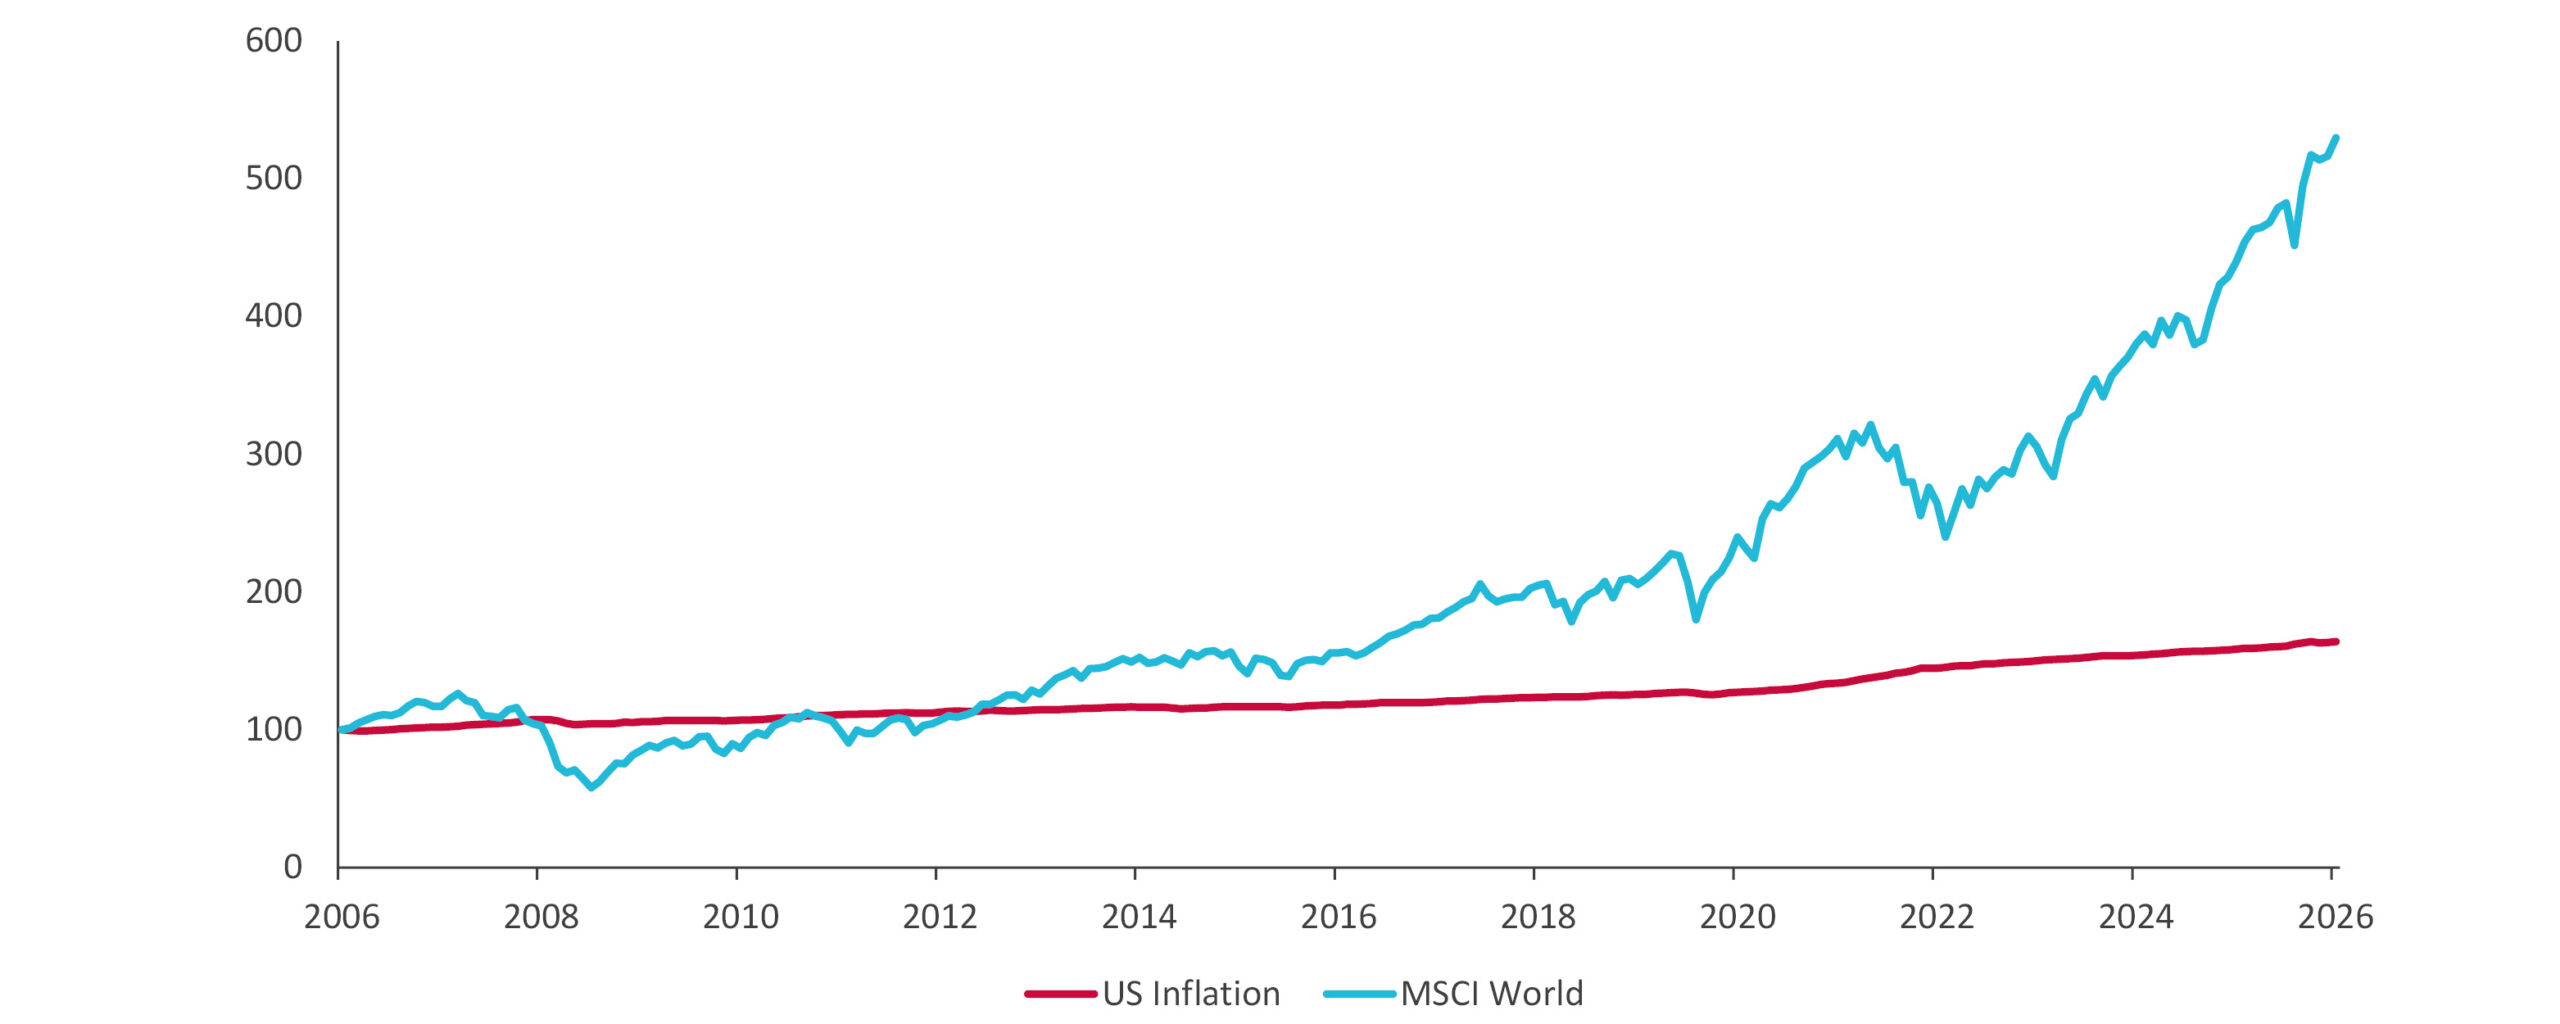
Over the past 20 years, owning the MSCI World Index has returned to investors 8.7% annualised in US dollars.
Considering US CPI or inflation (annual percentage change) has averaged just over 2.5% for this period, there is little debating that investing in the market has been a winning strategy.
To understand this, an investment of $1m in the MSCI World index 20 years ago, would be worth about $5.5m today.
At 2.5% annual inflation, $1.6m in 2026, would have the same buying power as $1.0m in 2006, 20 years ago. So, an investor has been enriched to the tune of 6.05% annualised or by $3.33m post inflation over the 20 years.
Chart 1: MSCI world versus US inflation
Source: Bloomberg
Has the index had a particularly strong run of late?
If we take the past three years of performance for the MSCI World Index, it has gained a staggering 20.11% annualised. This 3-year period is a significant relative returns outlier, exceeding 49 of the past 53 comparable 3-year periods. The average annualised 3-year return (prior to this period) was 10.5%.
What to expect after a purple patch of performance from the index?
If we define a healthy performance period for the index as an annualised return of more than 10% over the previous three years, what should investors reasonably expect thereafter? Historically, subsequent returns have tended to be more modest, with annualised returns of 5.6% over the following five years and 5.9% over the following ten years.
Is it hard for the average global active manager to outperform the MSCI World Index?
We analysed all the mainstream global equity funds over various periods, from 50 years to 1 year. Our findings and observations are what follows.
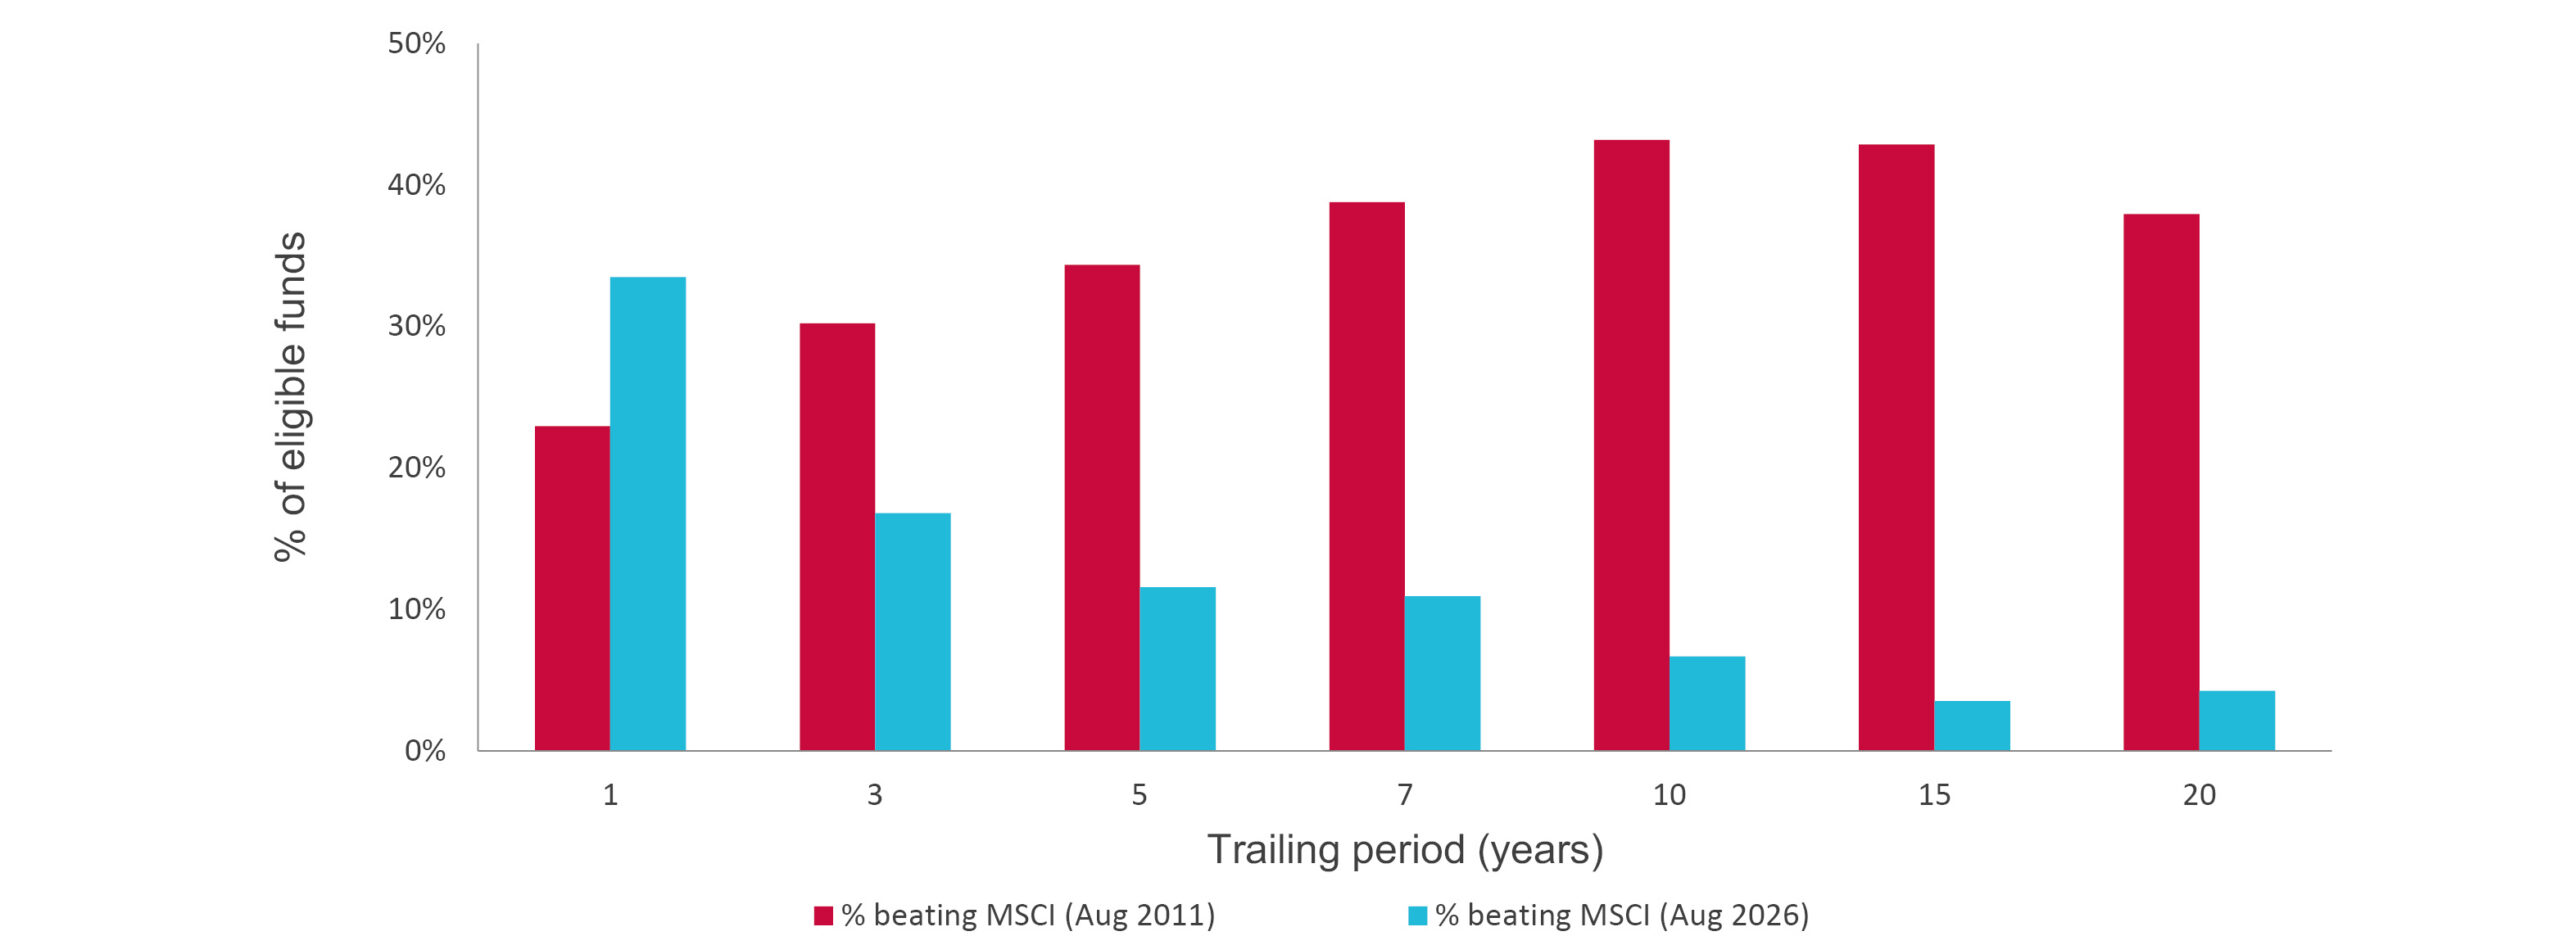
Firstly, there have been two distinct periods – before 2011 when active managers found it easier to outperform the market and post 2011, when indexing really took off. The below chart shows this clearly.
Chart 2: Percentage of funds beating the MSCI
Source: Morningstar; Northstar Asset Management
We believe that several macro factors catalysed this shift (low interest rates, cheap capital and elevated risk appetite), post-GFC in 2008. Once that locomotive started rolling, the weight of capital pouring into the passive industry resulted in a self-fulfilling prophecy. Whilst not for this article, those post 2008 factors, we argue, are starting to reverse.
Secondly, active managers struggle most during protracted periods of powerful upward momentum in the index, typically when returns exceed 15% annually. That has been the case since 2008!
Conversely, a higher percentage of active managers show relative outperformance against the index after these booms, when market returns are lower.
Active investment managers are valuation-driven, but when the stock market shifts into a lengthy bull market phase, share prices typically exceed what the underlying companies are worth. It thus makes sense that in these ‘blow-up’ periods, active managers will struggle.
Considering how well the markets have performed over the past 3 years, if previous performance cycles are repeated, active management should be in for happier times ahead.
Destroying client wealth – inappropriately buying and selling past performance
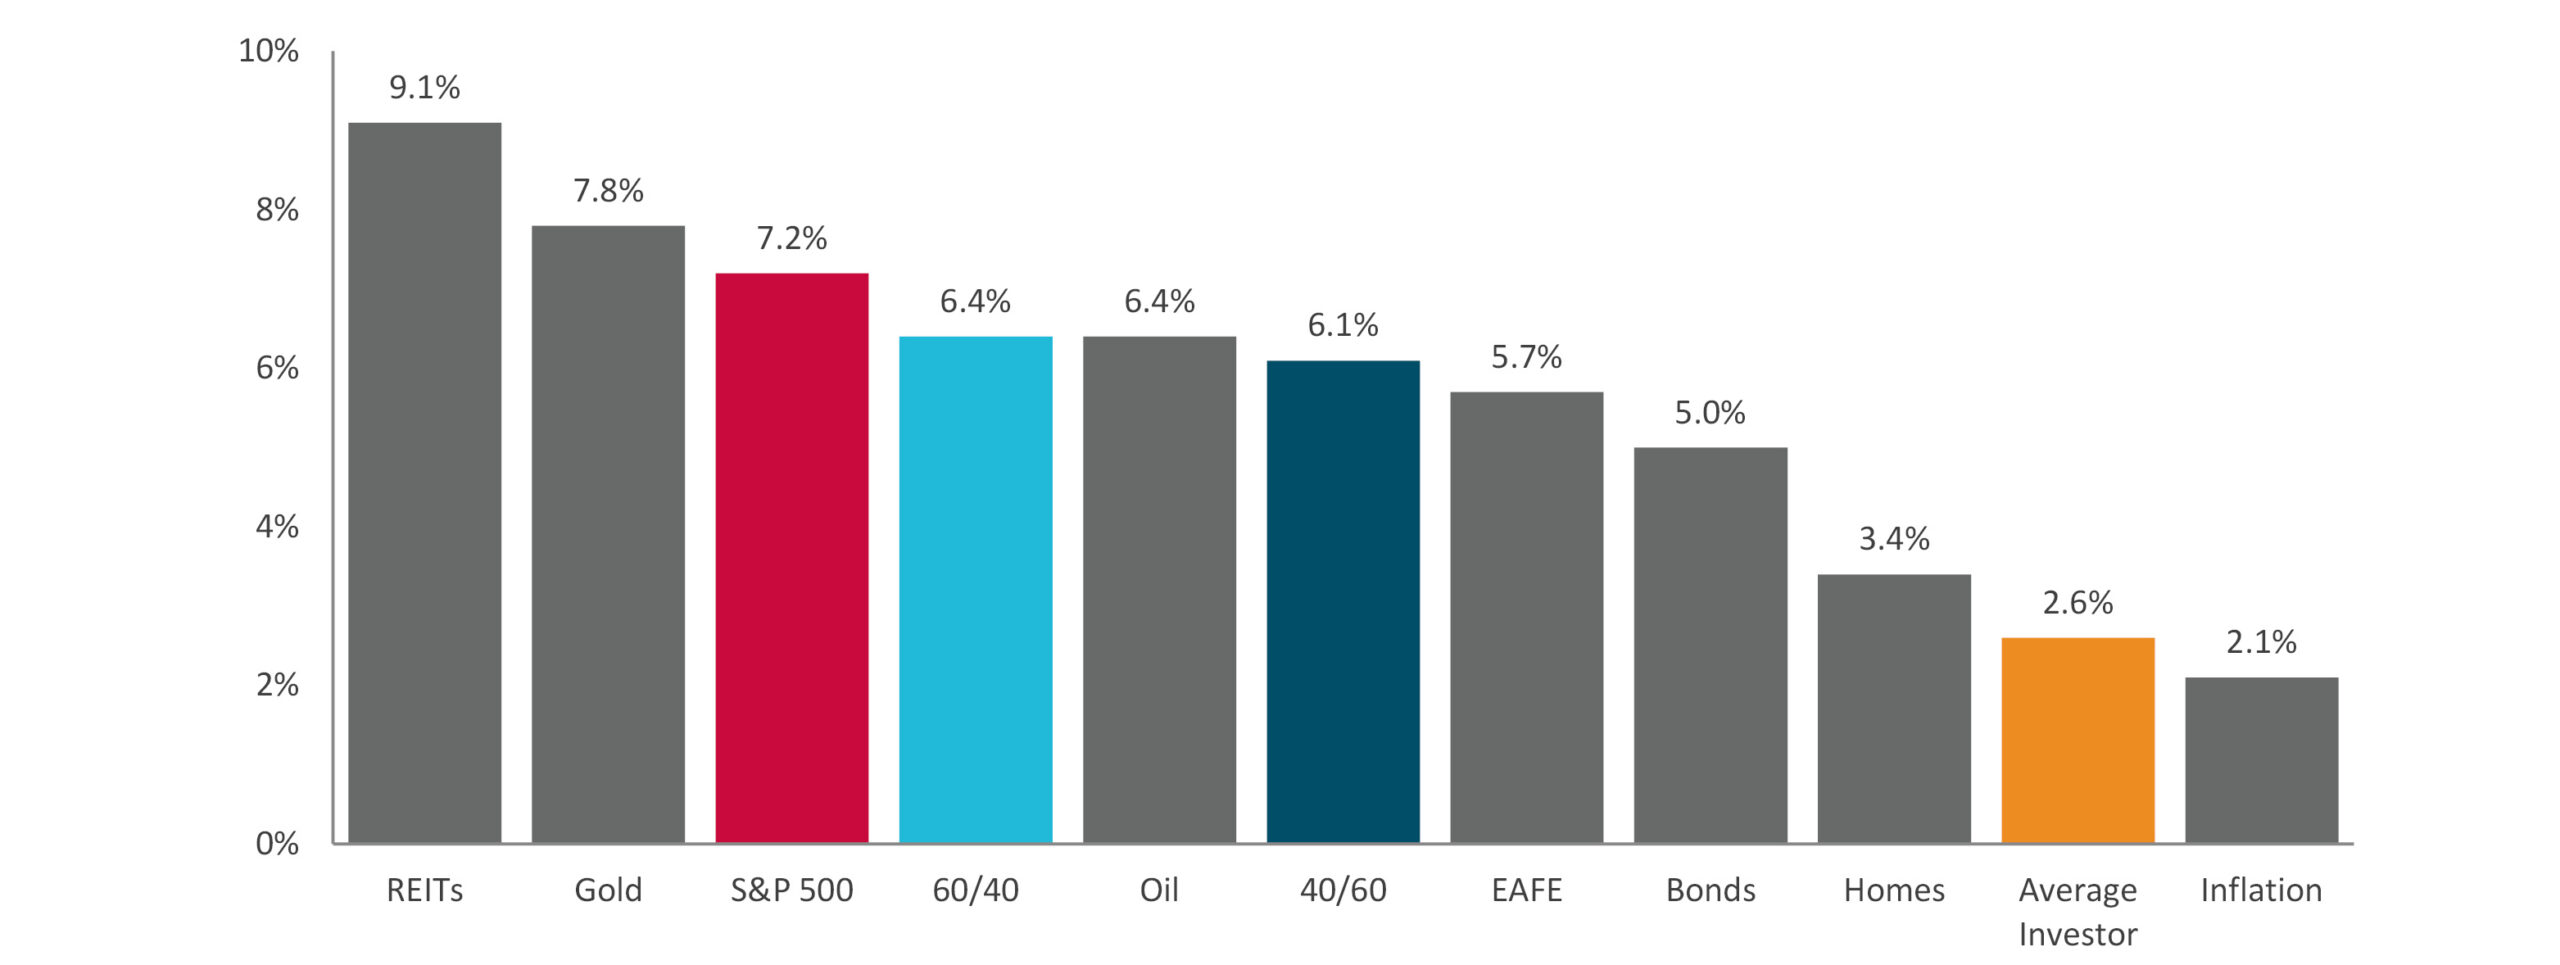
Albeit a few years old, research from JP Morgan and Dalbar from 2017 shows how the average investor underperforms most asset classes and market indices whilst just beating inflation over time.
Chart 3: 20-year annualised returns by asset class (1998 – 2017)
Source: Dalbar & J.P. Morgan; Period: 1998–2017
Dalbar’s research demonstrated that at the heart of this underperformance was that retail clients chase performance – buying at the wrong time; panic sell – fear selling when markets drop; hold funds for too short a period of time without allowing the performance proposition to unfold; trade excessively incurring fees; and live and respond to a world of media financial noise.
We are observing signs of these above-described behavioural traits on the rise among investors – the most prominent requests being to move from well managed active funds to passive indices, or to shift between active managers – chasing yesterday’s winners.
Index concentration – managing the odds of winning
The S&P 500 consists of 500 companies, we looked at the weighting of the 10 largest companies within that index through time, compared to the other 490 companies, and asked ourselves if this could give us a clue of future returns.
Our data range is from 1964, using 5-year rolling periods.
The main finding from our study is that when the weighting of the top 10 stocks in the index is below 18.8%, the largest companies outperform the other 490 companies 61% of the time in the subsequent 5-year period.
Conversely, when the weighting of the largest stocks accounts for over 23.4% of the index, the smaller stocks, the other 490, outperform 88% of the time for the subsequent 5-year period.
Considering the top 10 companies in the S&P 500 presently represent 38% of the market weighting of the index, the data would imply being underweight these stocks.
In essence, when concentration rises, the smart money starts to move away from the index, not into it!
Chart 4: Percentage of rolling 5-year periods in which the bottom 490 equal weight outperformed
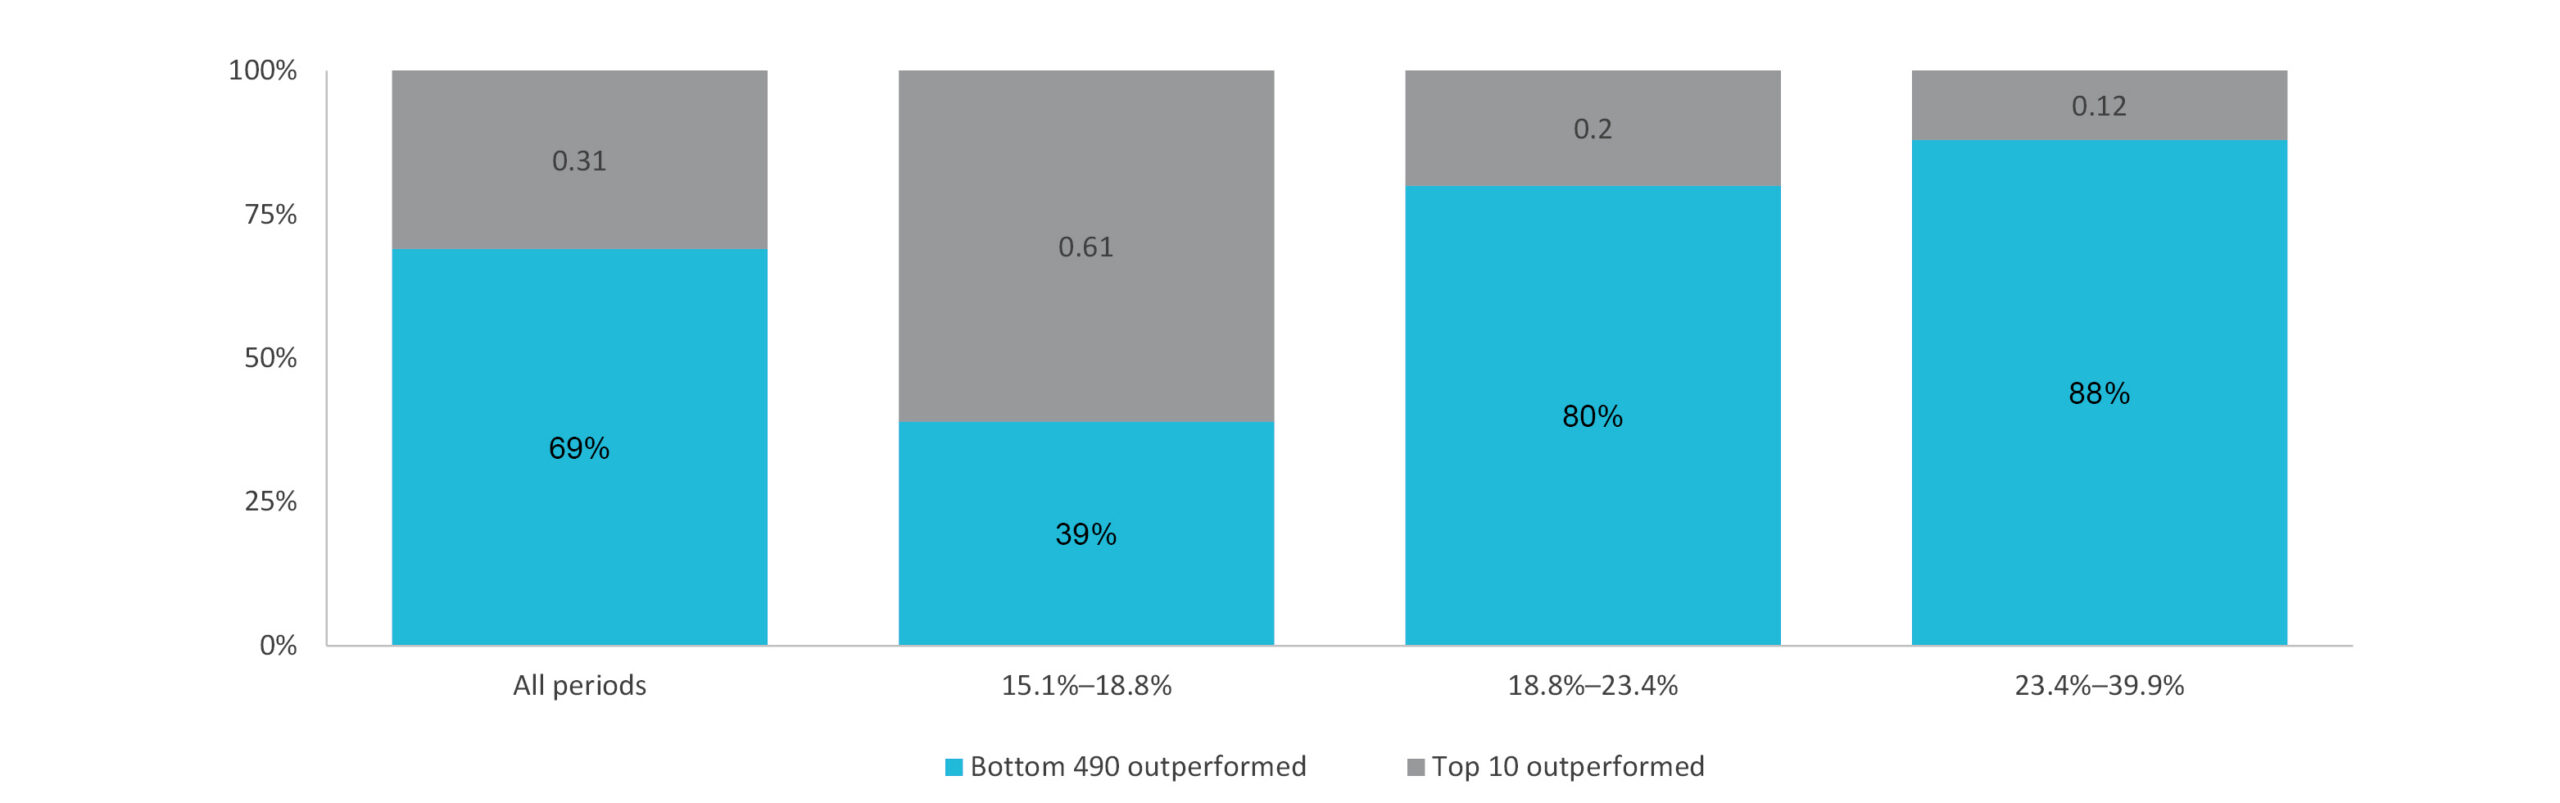
Top 10 concentration levels at the start of each period | Concentration observations divided equally into thirds
Source: Compustat; Hartford Equity Modeling Platform. Published by CFA Institute Research and Policy Center
Data range: 31 Dec 1964–31 Dec 2024. Based on the 500 largest US stocks by market capitalisation. Top 10 and bottom 490 portfolios were equal weighted and rebalanced monthly.
It’s not a guess; it’s our interpretation of the data to make a judgement call
This is not an industry that lends itself to exact predictions, quite the opposite, managing money professionally is complex science intertwined with magnificent art.
But as the profession ages, our data sets are deepening and growing, and we have the luxury of finding patterns in the numbers. Consequently, we can take a stab at what the odds are for future outcomes.
With this in mind, we feel the following judgement calls have a relatively high chance of playing out in the years ahead:
- The S&P 500 will begin to deliver single digit returns.
- The equally weighted index will outperform the market cap index – in other words, the largest capitalisation shares will underperform.
- The ingredients for higher-than-normal risk taking, which were present from 2008 onwards will fade and remove a tailwind for index obsession.
- Active managers will start to perform better.
- Investor behaviour will remain “stupid” and continue to be price-focused as against valuation-driven and wealth will be lost.
We feel that being unaware of where we are in the market cycle right now, will have a profound outcome for future winners versus losers!