
The S&P 500 has been one of the most reliable wealth-creation machines in history. Over the past 66 years, it has delivered double-digit nominal returns in one stretch and solid single-digit gains in another. Yet dig beneath the surface and the story changes dramatically. What drove those returns was never the headline GDP number alone – it was the quiet interplay of productivity, corporate profit share, inflation, dividends, and valuation multiples. Today, that same mix points to surprisingly modest prospective returns over the next ten years… unless a true productivity revolution (think Elon Musk’s Optimus robots and AI scaling at warp speed) finally arrives.
Two Very Different Eras: 1960–1990 vs 1990–Early 2026
Look at the numbers side by side (see the table below for the full decomposition):
1960–1990
- Real GDP grew a healthy 3.2% a year, powered by 2.1% productivity growth (the post-war productivity miracle).
- But almost none of that growth reached corporate bottom lines. Profit share and margins contracted sharply – from peaks near 8–11% down toward 4–5% by 1990. Strong unions, oil shocks, and high inflation (5.1% average) meant labour captured the productivity gains while companies fought rising costs.
- Real earnings growth? Effectively 0.0%.
- The only real help came from a steady 3.5% average dividend yield and almost no valuation change (Shiller PE drifted gently from 18.3 to 17.1).
- Result: nominal total return 8.5%, real return 3.2%. Solid, but nothing spectacular once inflation bit.
1990–Early 2026
- Real GDP slowed to 2.6%, productivity to 1.95%.
- But margins exploded – from ~5.5% to 13.5%. Globalisation, tech scaling, lower taxes, and the shift to high-margin software and platforms delivered a massive +1.5% annualised profit share boost.
- Real earnings growth jumped to 3.5%.
- Dividends fell to 1.9%, but valuations soared (Shiller PE from 17.1 all the way to 39.0) – the classic 1990s–2020s re-rating.
- Result: nominal total return 10.6%, real return 7.9%. The golden era investors still reminisce about.
The contrast is stark. In the first period, productivity was strong but profit share collapsed. In the second, profit share soared and valuations expanded even as productivity slowed. Real earnings – the true engine of stock returns – was the difference.
Looking Ahead: Constructive Drivers, But Poor Math
The next ten years start from a very different place. The Shiller PE sits at ~39 – one of the highest levels in history. That single fact creates a heavy valuation headwind. Even if the underlying economy and corporate America remain constructive, the numbers today point to modest – or even negative – real returns unless something extraordinary happens.
Here are the three scenarios based on the same drivers we’ve tracked historically:
Bear Case (most painful path) Real GDP 1.4%, productivity 1.5%, margins compress back to ~10.5% (tariffs, reshoring, and limited automation). Real earnings shrink –1.0%. Dividends 2.0%. Shiller PE derates to 20.0.
- Nominal total return –3.7%, real return –5.6%. A lost decade reminiscent of the 1970s.
Base Case (most probable) Real GDP 1.9%, productivity 1.8%, mild margin contraction to ~12.5%. Real earnings +1.0%. Dividends 2.0%. Shiller PE falls to 32.5.
- Nominal total return 3.2%, real return 1.2%. Barely keeps pace with inflation – hardly exciting after the post-1990 boom.
Bull Case – The “Elon World” Scenario Real GDP 2.4%, productivity surges to 2.4% (AI and humanoid robots deliver the long-awaited total-factor-productivity boom). Margins expand further to ~14.5%. Real earnings +3.1%. Dividends 2.0%. Shiller PE rises to 45x.
- Nominal total return 8.8%, real return 6.7%. This is the optimistic path many AI bulls are pricing in – exactly the kind of productivity-plus-margin tailwind that powered the 1990–2026 period.
Why Returns Look Poor Despite Constructive Views
The uncomfortable truth is that today’s starting valuation does most of the damage (see Figure 1: Shiller PE Ratio). The Shiller PE Chart tracks valuation multiples from 1870 through the present and into the 2030 forecast, revealing that the current level near 39 stands among the highest in more than 150 years of data. Its relevance is clear: such elevated starting valuations have historically preceded periods of lower or even negative real returns through mean-reversion and multiple contraction, creating a powerful headwind that can overwhelm even strong underlying drivers like productivity and margins.In short: the S&P 500 isn’t broken. The drivers (productivity, profit share, dividends) can still be constructive. But starting from a Shiller PE of 39 means the next decade will feel very different from the last three. Unless we get the Elon-style robotics and AI revolution that finally lifts productivity and margins simultaneously, investors should temper expectations. The golden era of effortless double-digit real returns may be behind us – or it may be waiting for the robots to arrive.The table that follows summarises every driver and the resulting returns for easy reference:Bottom line: watch productivity and margins more than headline GDP. The next ten years will be decided by whether corporate America can once again capture a rising share of a growing economic pie – or whether today’s lofty valuations force a painful reset. The Elon-world bull case is the one scenario where optimism and reality finally align.
Table 1: S&P 500 Returns Decomposition – Historical Periods and 10-Year Forecasts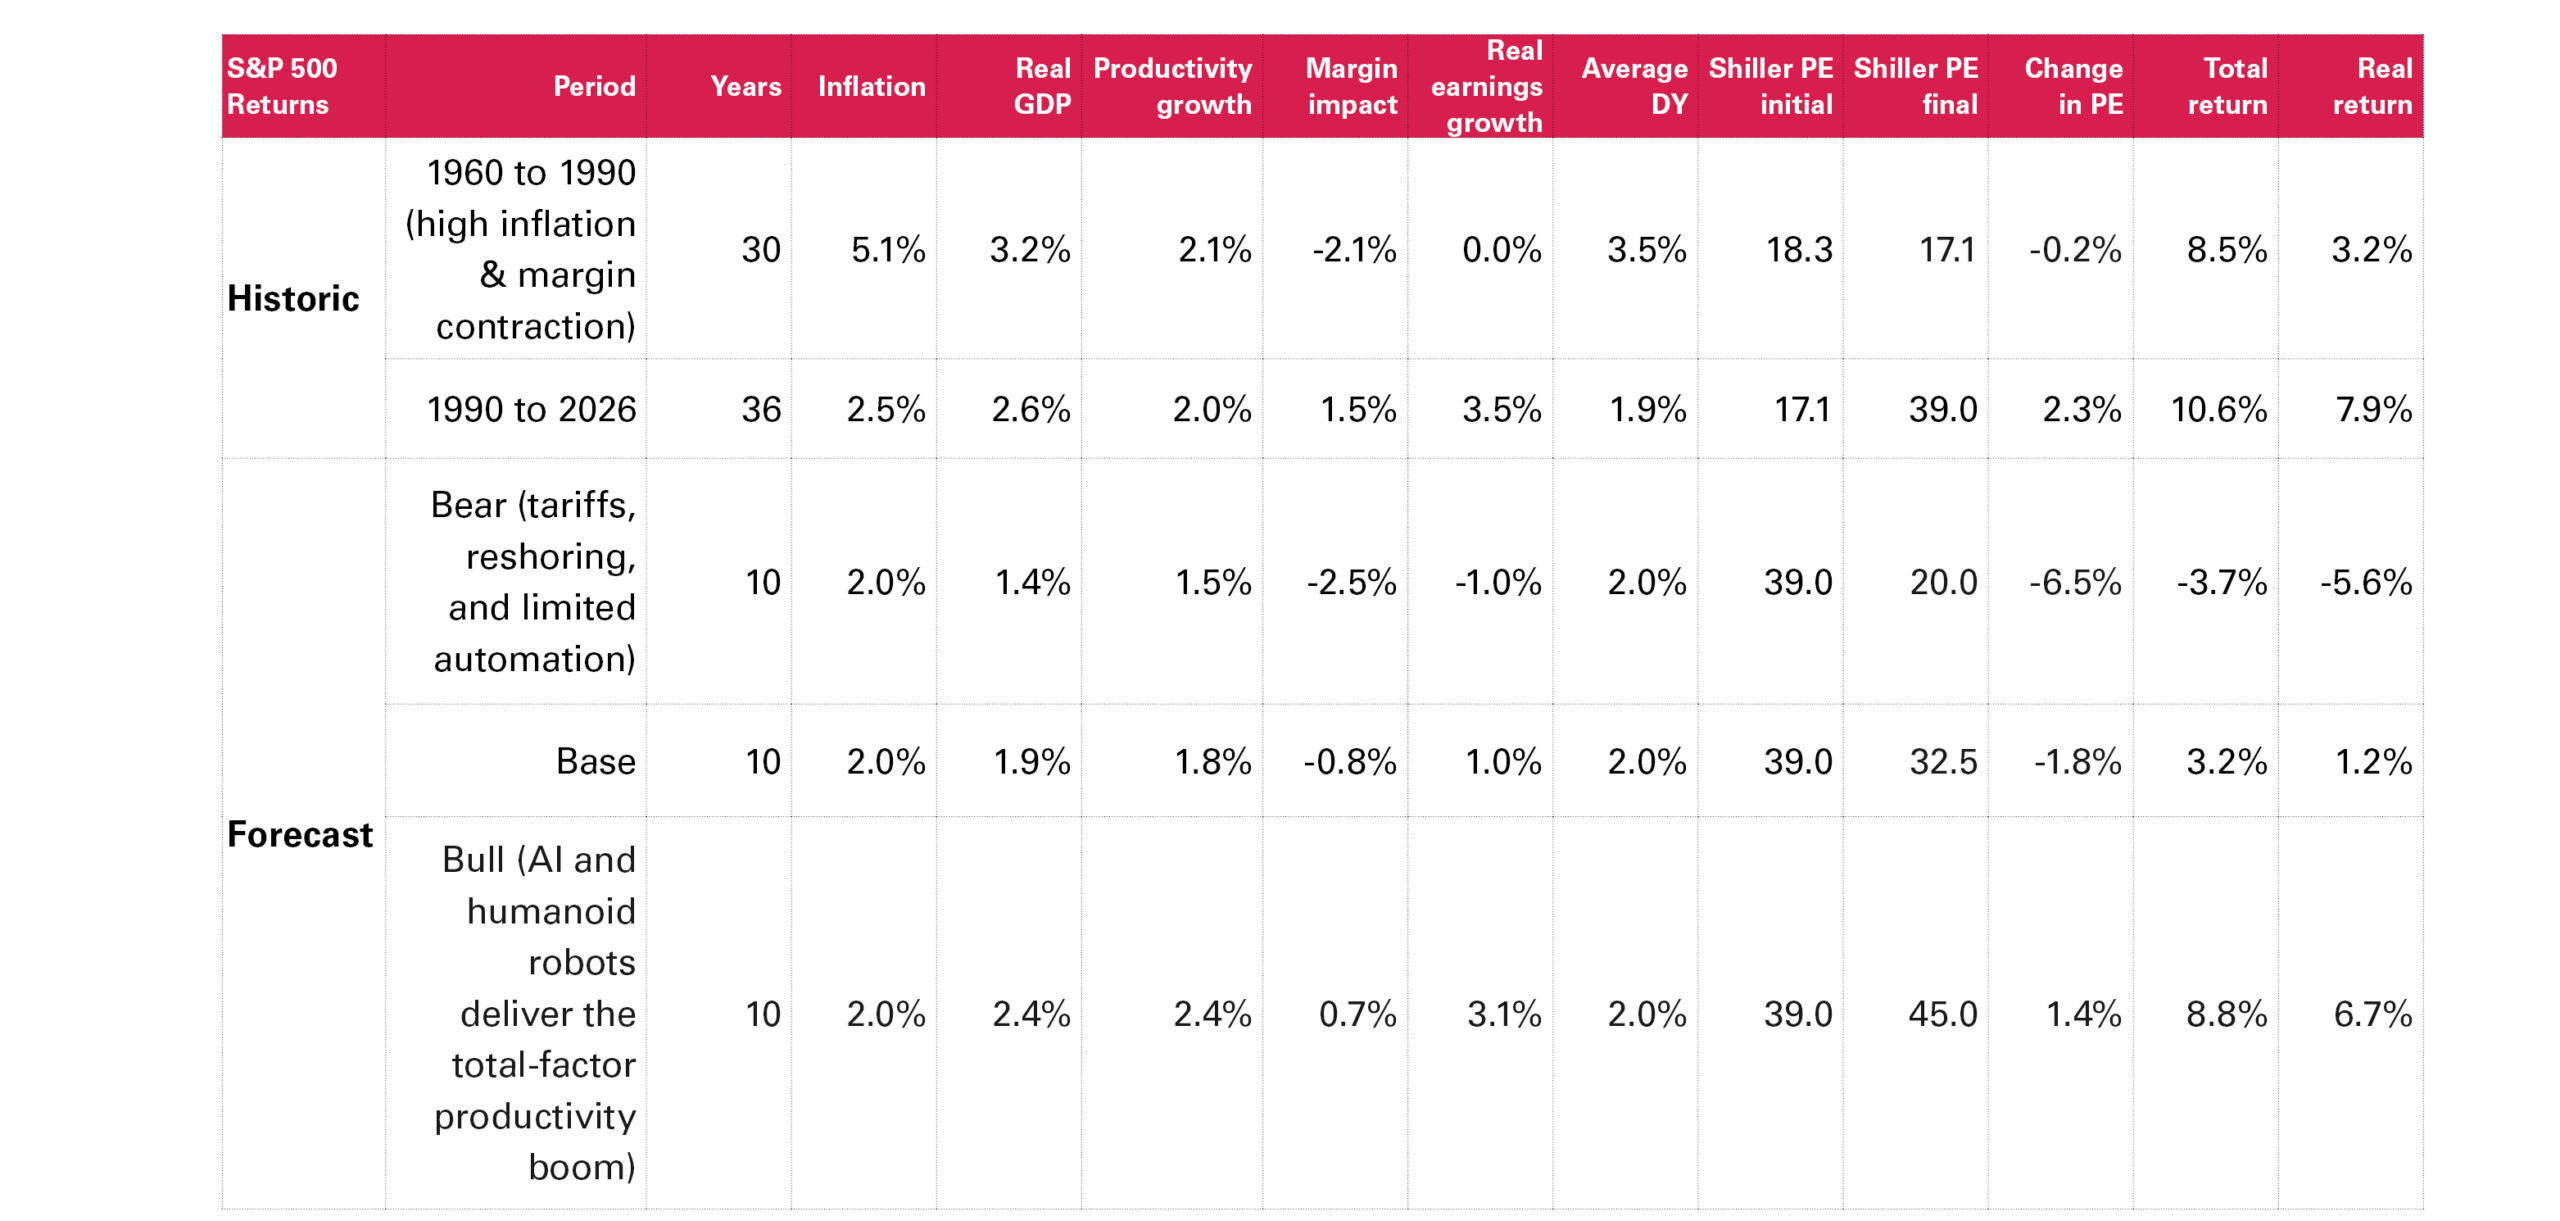
Source: Northstar, Iress & Shiller PE Ratio data sourced from Multpl.com:https://www.multpl.com/shiller-pe
Chart 3: Shiller PE Ratio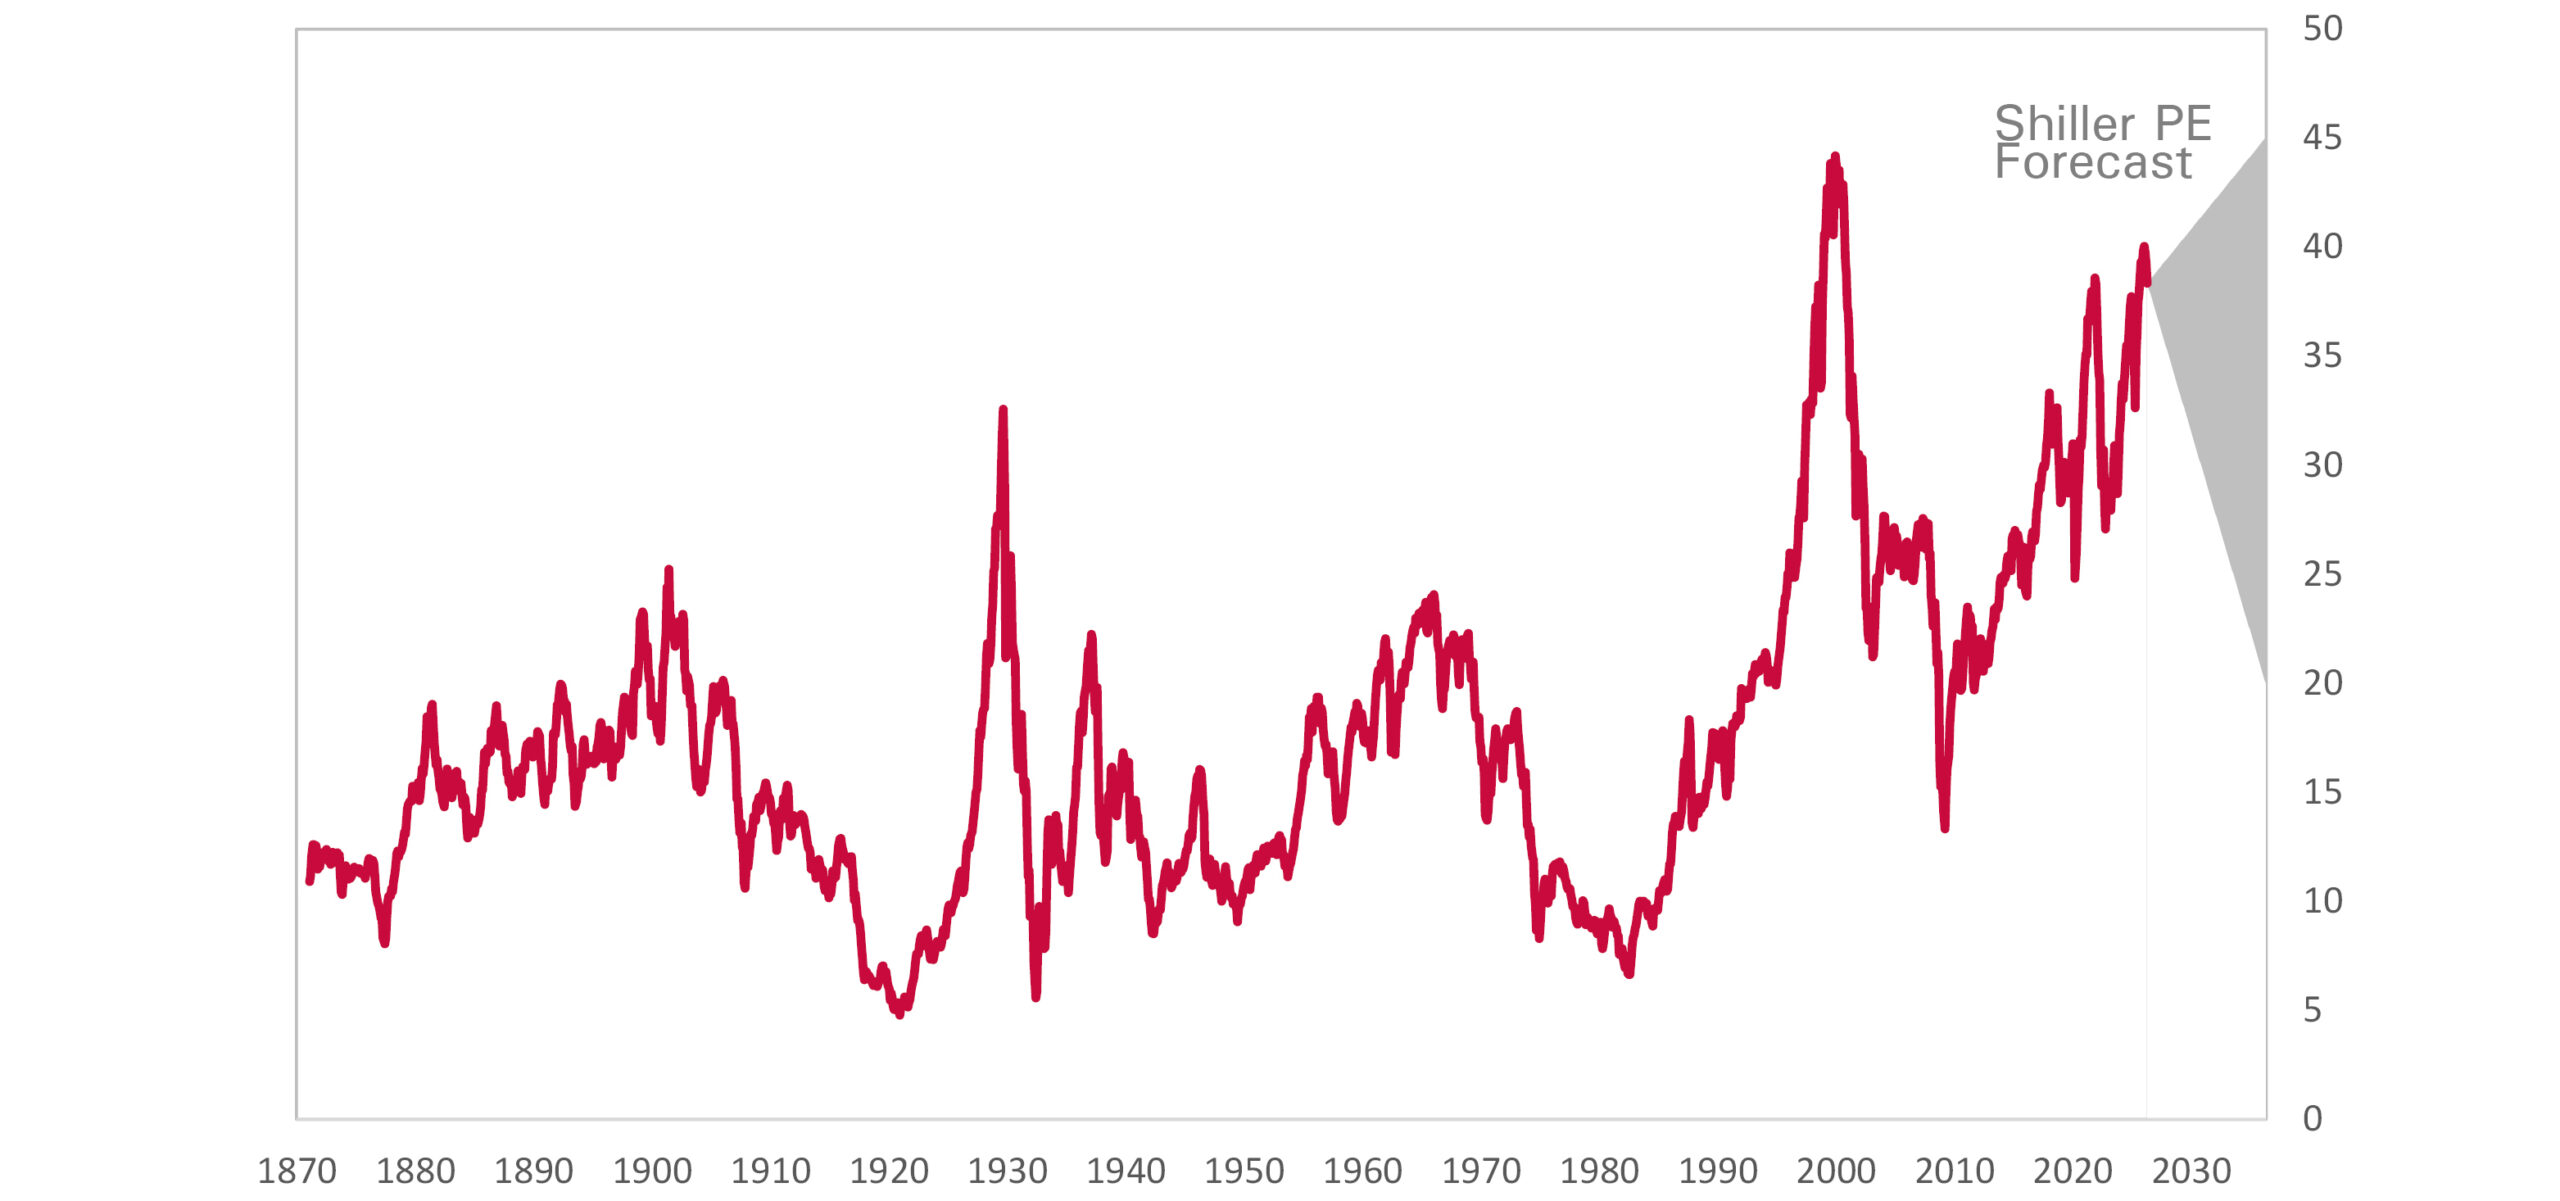
Source: Shiller PE Ratio data sourced from Multpl.com:https://www.multpl.com/shiller-pe